Issue Resolver Results
Overview
The Issue Resolver Results widget shows how data quality issues were handled during processing and how the resolution results compare with the average of the last 5 runs. It helps users understand how many issues were resolved, left unresolved, or handled through different resolution actions.
This widget is part of the Data Quality Processor Results dashboard and focuses on issue resolution outcomes using an interactive Sankey visualization that updates based on the selected resolution category.
What the Widget Analyzes
Profiling dimension: Issue resolution outcomes
Level of analysis:
-
Dataset-level issue resolution summary
-
Rule-level and column-level issue resolution results (as applicable)
Calculation basis:
-
Data quality issues identified during validation are passed to the issue resolver
-
Issues are processed based on configured resolution logic
-
Each issue is categorized based on its resolution outcome
-
Current run results are compared with the average of the last 5 runs to show trends
The analysis helps track how effectively issues are being handled over time.
What the Widget Shows
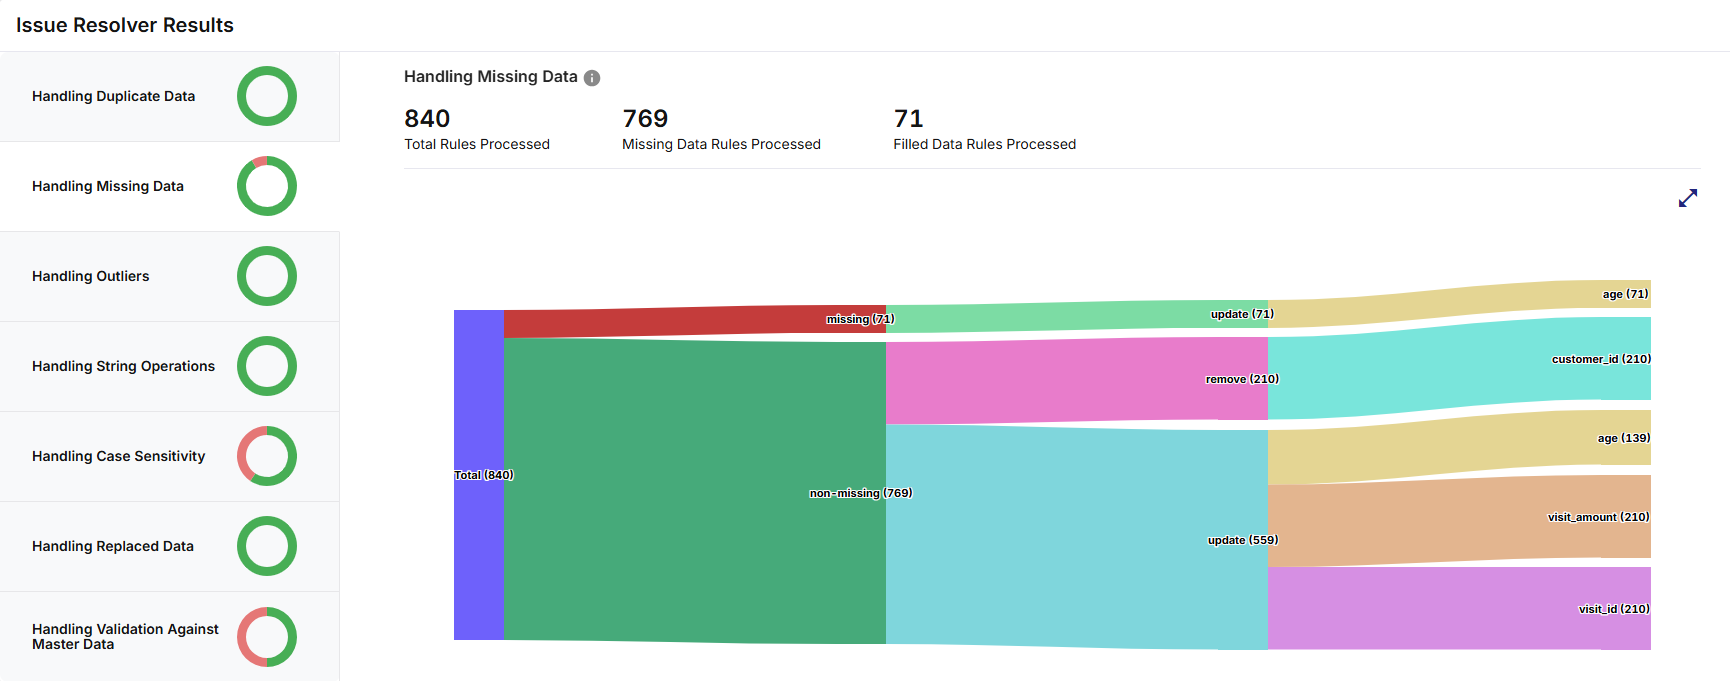
The widget displays a Sankey-style flow visualization that changes based on the left pane selection. Depending on the selected category in the left pane, the Sankey graph shows:
-
Total issues processed
-
Issue distribution based on resolution outcome (passed or failed)
-
Counts for each resolution path
This dynamic behavior allows users to analyze issue resolution from multiple perspectives using the same widget.

Note:
The exact labels shown in the Sankey graph depend on the selected resolution category in the left pane. Only the statuses relevant to the current selection are displayed in the widget.
How to Read This Widget
Sankey Visualization
-
The Sankey flow starts with Total issues, then the flow splits into corresponding resolution status based on the selected resolution category from the left pane. For example:
-
Passed / Failed
-
Missing / Non-Missing
-
Outlier / Non-Outlier
-
Replaced / Non-Replaced
-
Case-Compliant / Case-Converted
-
-
Subsequent flows show how issues are distributed across resolution outcomes
-
Flow thickness represents the number of issues contributing to each path
-
The Sankey graph updates immediately when a different option is selected from the left pane
-
Hovering over any flow displays:
-
Resolution label based on current resolution category selection
-
Issue count
-
Resolution Category Selection
The left pane acts as a resolution category context selector for the Sankey graph. Each selection:
-
Changes the labels shown in the Sankey graph
-
Updates count
-
Focuses the analysis on a specific resolution perspective
This allows users to analyze:
-
Overall issue resolution
-
Specific resolution outcomes
-
Changes in resolution behavior across runs
Widget Interactions
The widget supports the following interactions:
-
Hovering over Sankey flows displays issue counts based on the current resolution category selection.
-
Clicking supported indicators opens a trend comparison view. This view compares the current run results with the last 5 runs for the selected resolution category.
-
Click the download icon to export the result as PDF, CSV, or XLSX file. You can either download a consolidated file or individual widgets.
-
Download individual widgets to analyze specific visualizations in detail and gain deeper insights. Files are saved using a standard naming format by default, which you can rename locally after download:
<Data Quality Stage name>_<Category name>_<Source Table name>.<pdf | csv | xlsx>
Example: IssueResolverResults_HandlingDuplicateData_benchmarks.pdf
-
For consolidated Excel downloads, each widget is exported to a separate worksheet. For example, three widgets are saved as three sheets within a single Excel file.
-
Note:
The widget interactions are read-only and do not modify issue resolution logic or data.
How to Interpret the Results
-
A high proportion of resolved issues indicates effective resolution logic.
-
A growing unresolved flow may indicate gaps in resolution rules.
-
Consistent resolution patterns across runs suggest stable issue handling.
-
Sudden changes compared to the last 5 runs may require configuration review.
When to Use This Widget
-
To understand how data quality issues are resolved
-
To monitor effectiveness of issue resolution logic
-
To identify unresolved or ignored issues
-
To compare issue resolution behavior across runs
-
To support continuous improvement of data quality processes
 Recommended Topics Recommended Topics
|
What's next? Data Completeness |